OVERVIEW
A Complete, Data-Driven TV and Radio Attribution Platform
Our software gives media buyers spot-level answers with very little setup.
For every TV and radio airing, we estimate the incremental lift over a baseline built from your own historical web activity.
Seamless GA4 Integration & Flexible Data Sources
Connect in minutes with a read-only Google Analytics 4 integration. There is no pixel to install and no code to change. From there you get spot-level TV and radio attribution and a clear read on which parts of the schedule are working.
Need more than GA4? We also work with Adobe Analytics, call-center logs or any internal dataset with a timestamp, so web, phone and order response can be measured side by side and fed into campaign planning and evaluation.

PRODUCT DESCRIPTION
What We Do: TV and Radio Attribution
- We measure the impact of every individual TV and Radio commercial in your media schedule.
- Each ad’s influence is tracked across three independent KPIs, quantifying incremental lift beyond a baseline.
- A geo-fenced baseline is established for each ad and KPI to determine what would have occurred without the commercial’s influence.
- If multiple ads run in close geographic or temporal proximity, their contributions can be shared proportionally.
- The resulting dataset enables comprehensive, flexible reporting at various breakouts (Station, Creative, Creative Length, Market, Network) over weekly, monthly, or quarterly intervals.
- Beyond standard dashboards, you can opt for customized reports or Excel outputs for deeper analysis.
Radio works the same way. Local and national radio, satellite radio and live reads are matched to response with the same method and reported alongside TV, so cost per response can be compared across both. See how radio attribution works.
MEASUREMENT KPIS
Tracking What Matters To You
Choose any three metrics from your Google Analytics 4 account or a custom dataset. Common choices include sessions, new users, leads, purchases, donations, sign-ups and registrations.
Upload New Media Schedules
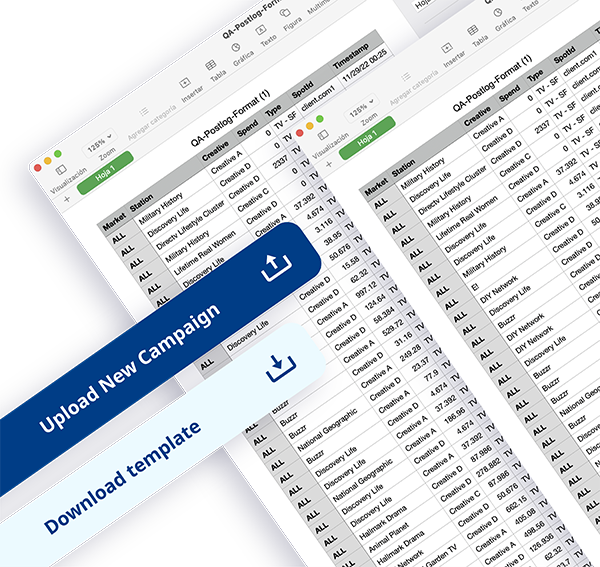
Quick and easy upload process.
Optional managed service: We can combine, transform, and upload custom post-logs for a monthly fee.
Campaign Details
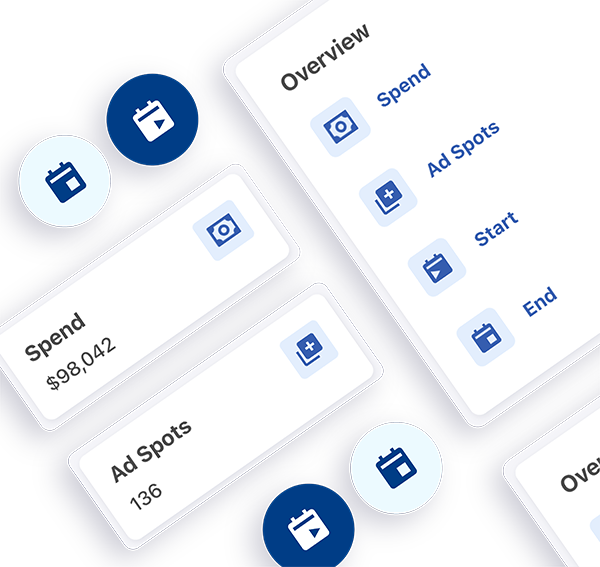
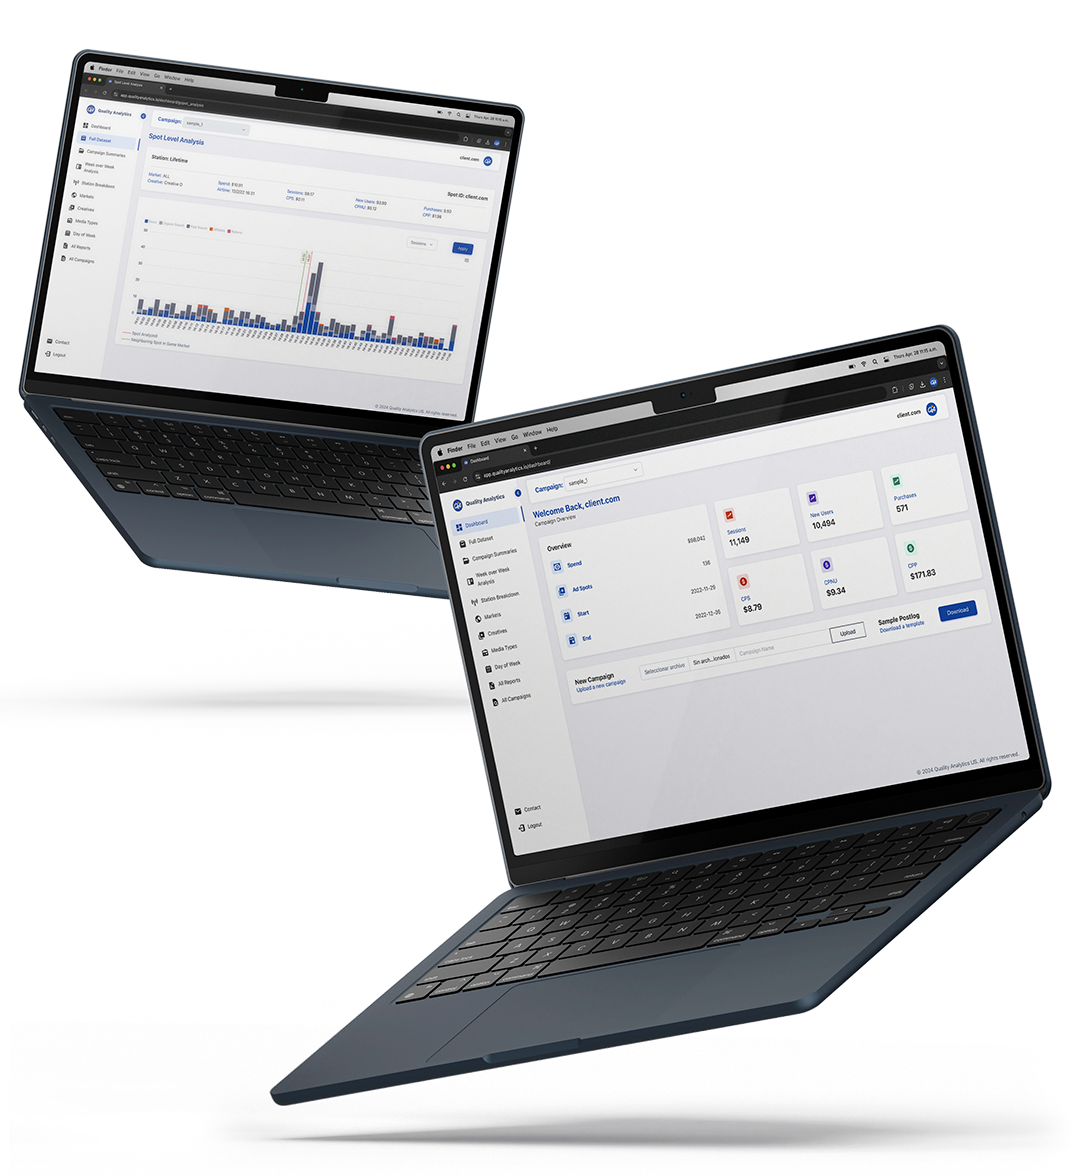
Quickly see your campaign details at a glance.
- Spend: Total cost of your media campaign
- Ad Spots: Number of TV and radio spots cleared
- Start: Media start times
- End: Media end times
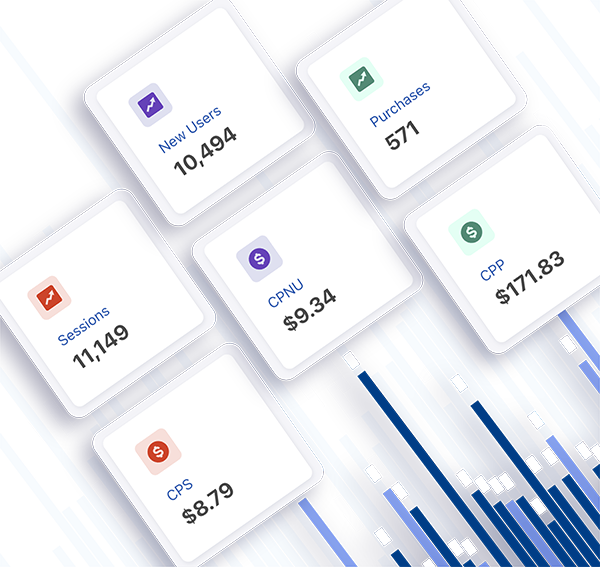
Incremental KPIs and Cost-Per Metrics
Every report includes cost-per metrics, so you can see at a glance which part of the campaign has the lowest cost per action.
- Sessions
- New Users
- Leads
- Purchases
- Revenue
Media optimization tools
REPORTING FOCUS
Comprehensive Reporting
We offer a full range of transparent reporting for your TV and radio campaigns. Because every airing is measured independently, results can be broken out by market, creative, creative length, station, daypart, day of week and more.
Station Reporting
Full Data Set
Market Report
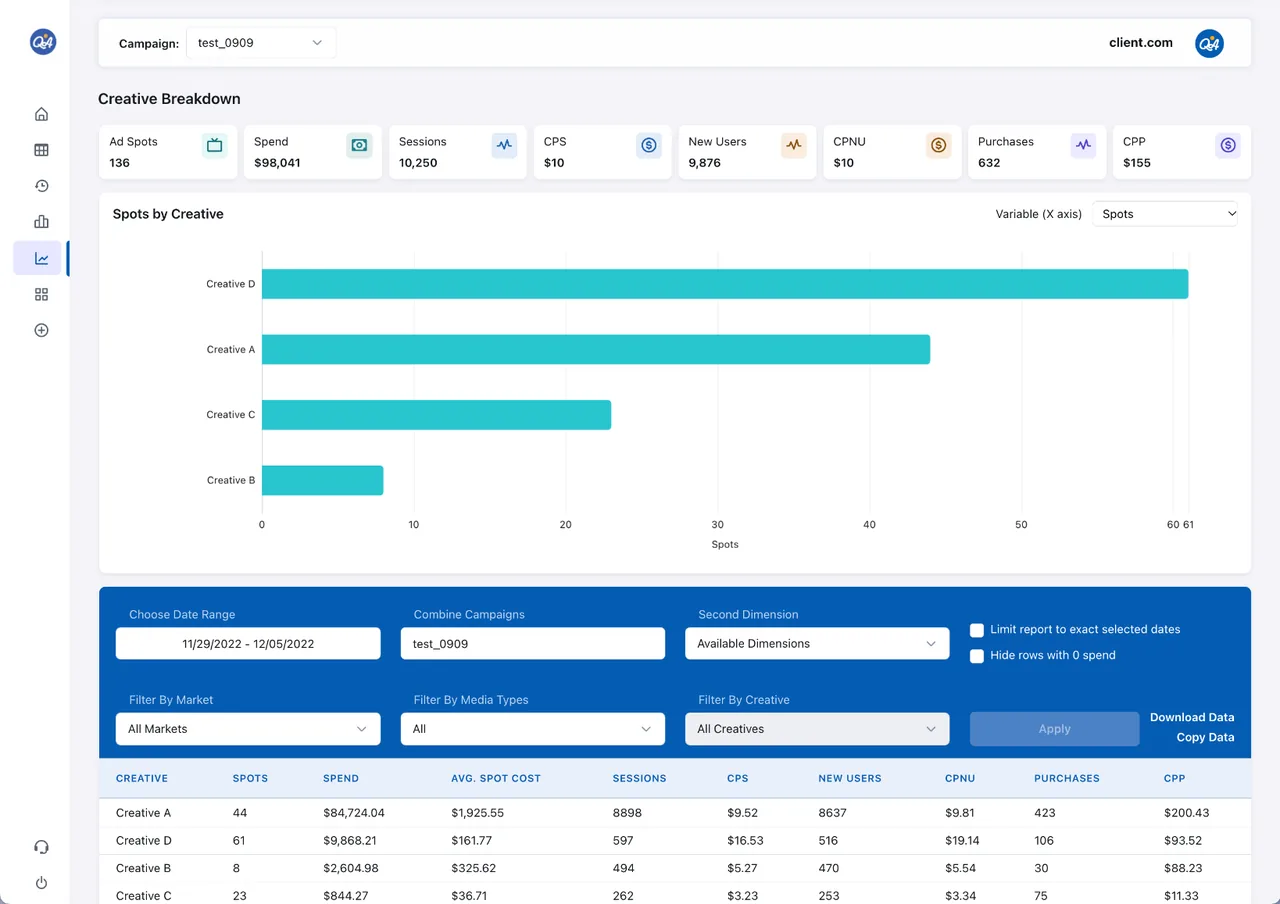
Creative Report
Campaign Change Analysis
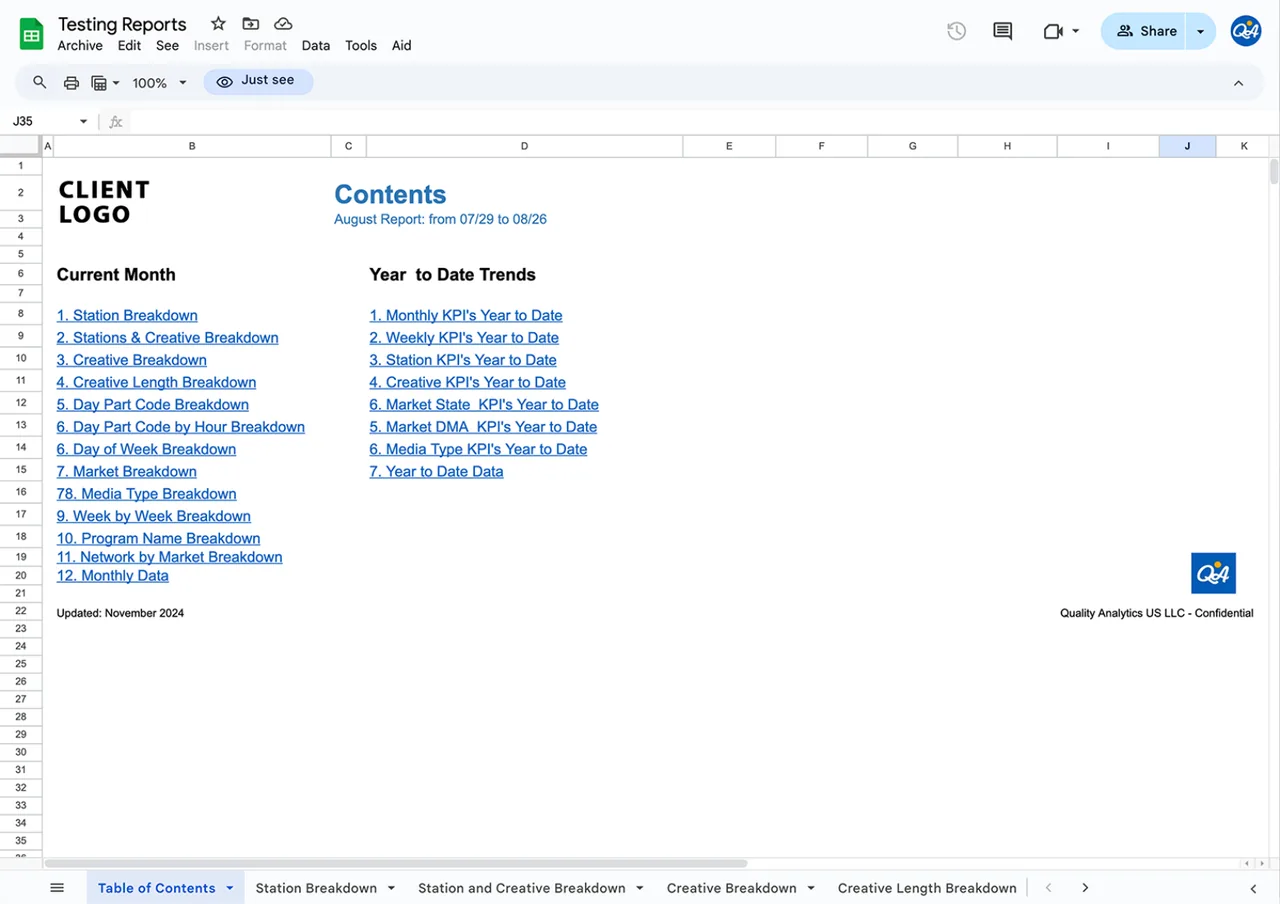
Custom Excel Reporting
REPORTING FOCUS
Station Reporting
The Station Report shows how each TV or radio station contributes to overall performance.
With spend, spots and key conversion metrics side by side, you can see where the budget is delivering the most value and where to adjust the mix.
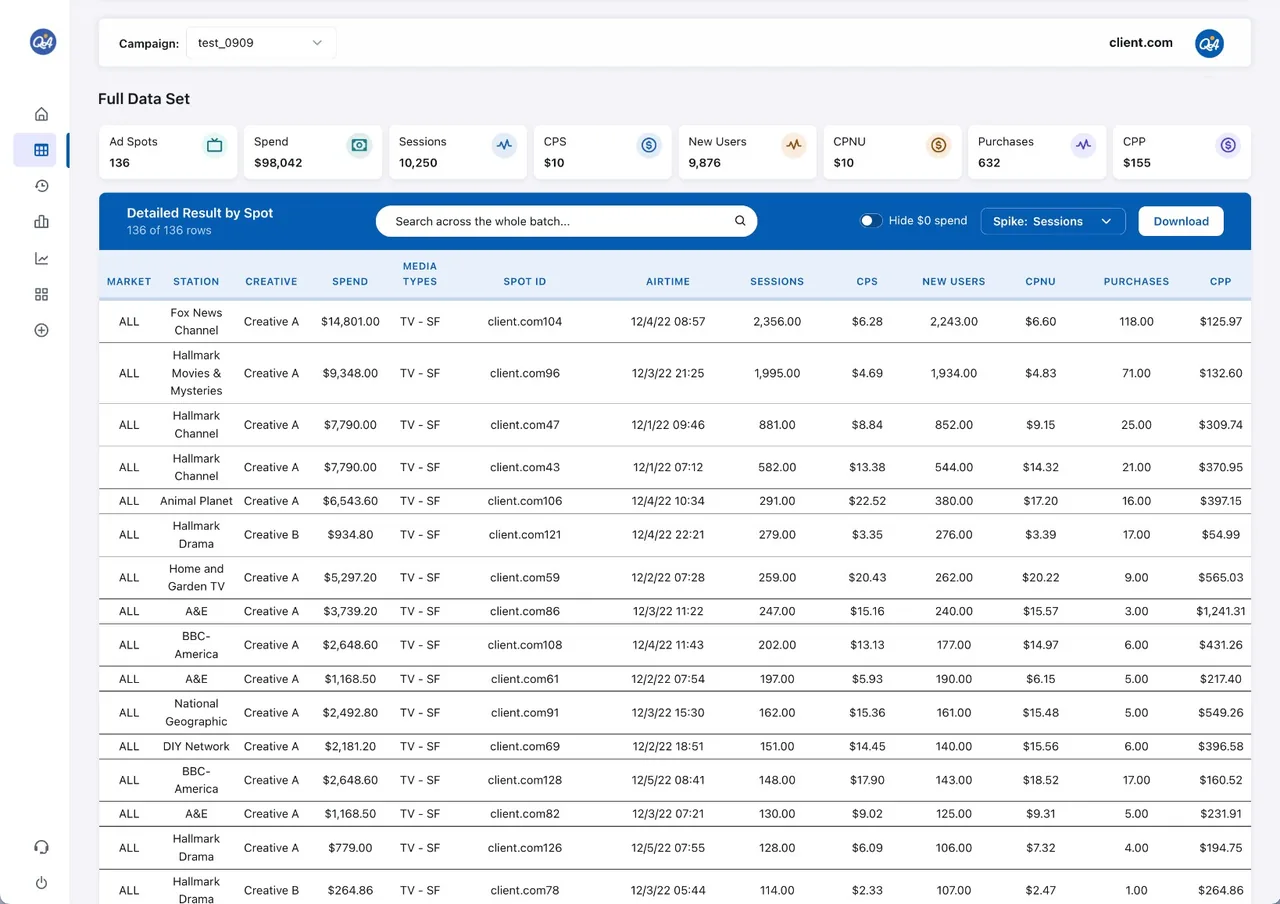
Detailed Result by Spot
Full Data Set
The Full Data Set report provides the complete spot-level data behind every result. It is built for analysts and teams who want to run their own calculations, explore patterns and check our work.
With direct access to this level of detail, you can validate results against your own records and refine your approach to TV and radio attribution.
Reporting Summary
Market Report
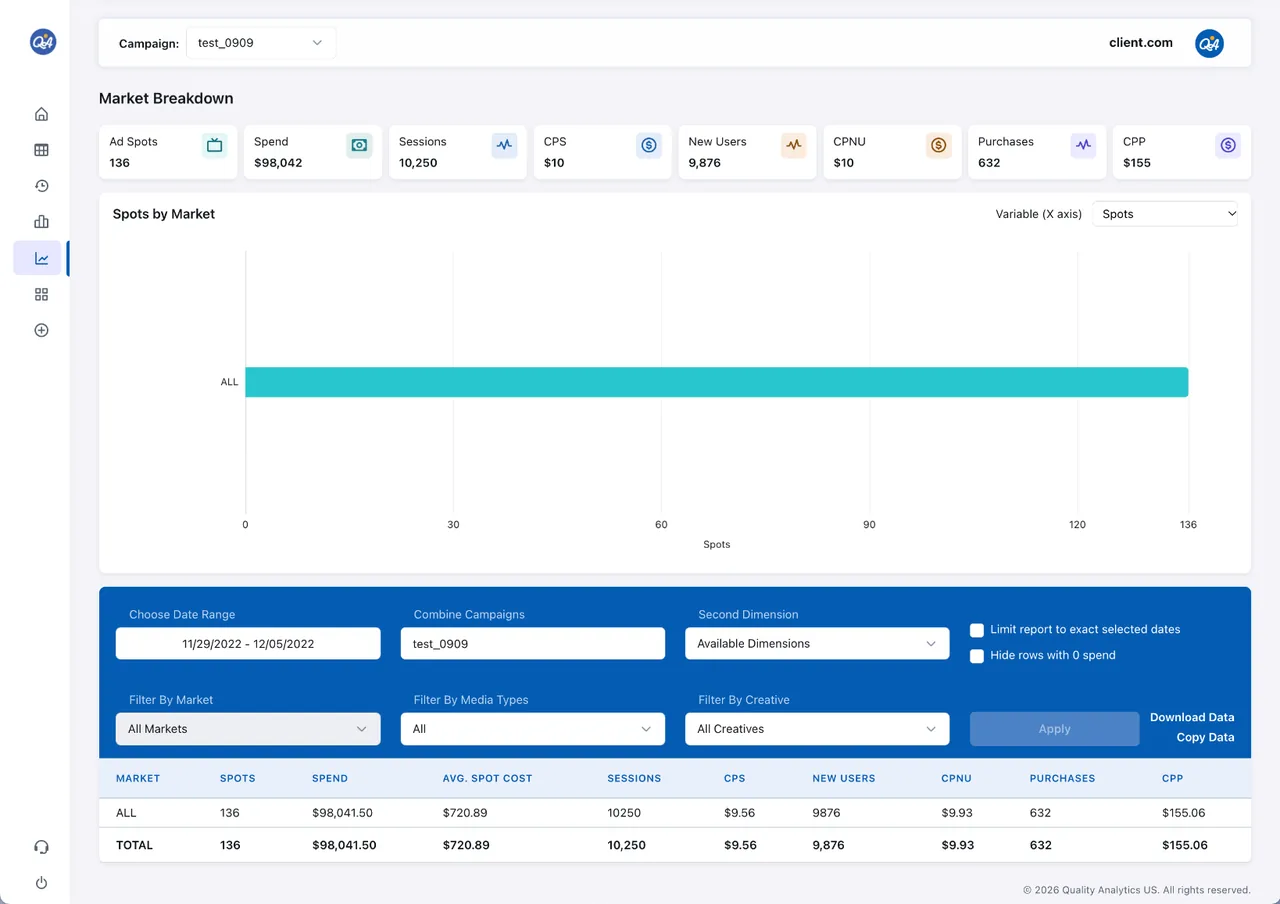
The Market Report gives a local view of your campaigns, showing how each market performs against your KPIs.
Regional differences are easy to see, which makes it simpler to move spend toward the markets that respond.
Reporting Summary
Creative Report
The Creative Report shows which ads resonate. Performance is attributed to each creative, so you can compare messages, offers and spot lengths on equal terms.
Use it to put more weight behind the creatives that deliver the most lift and retire the ones that do not.
Compare Two Sets Of Results
Campaign Change Analysis
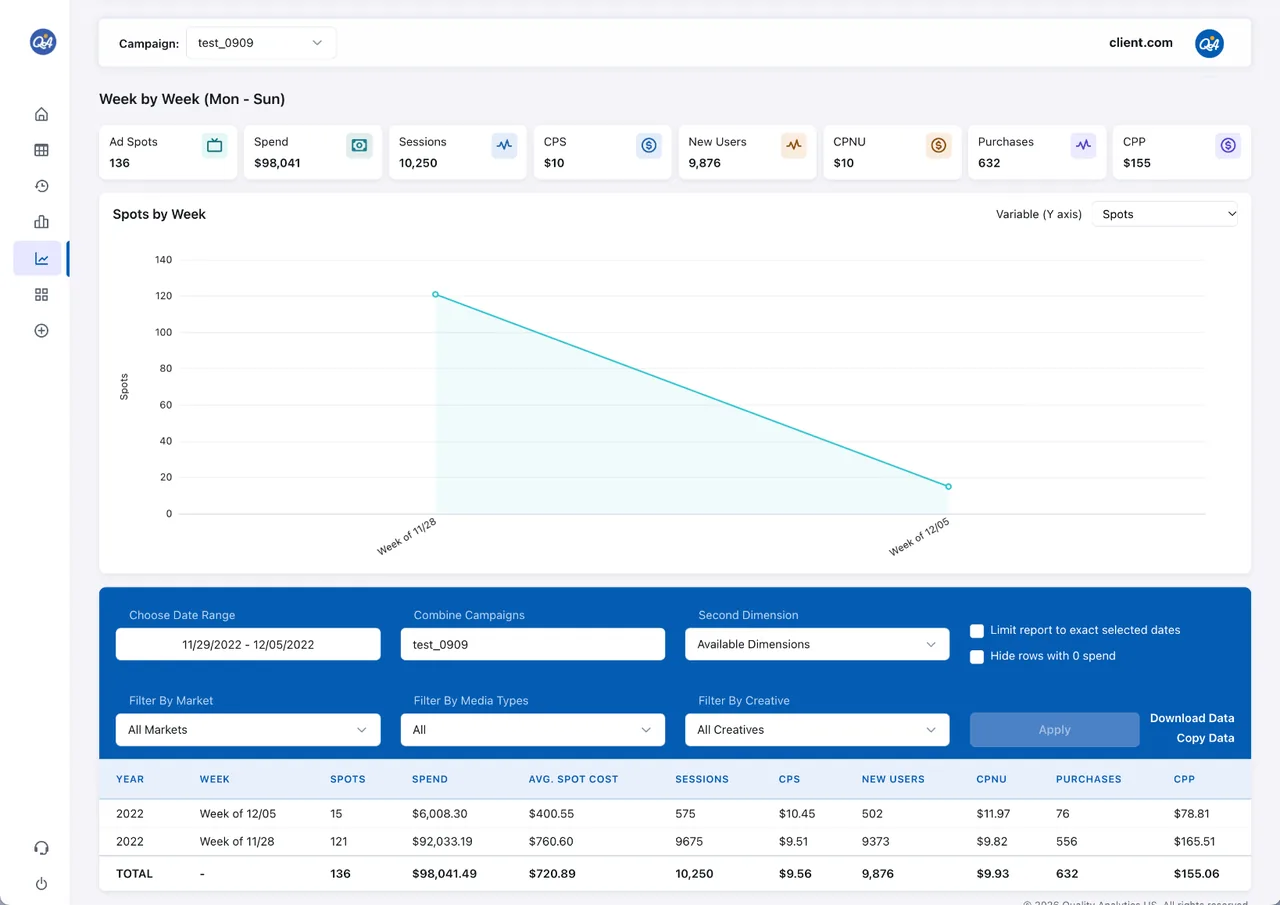
The Week-over-Week Report tracks changes in core metrics across consecutive weeks, showing emerging trends and the effect of recent optimizations.
Comparing periods side by side lets you confirm that a schedule change worked before committing more budget to it.
Spot Level Analysis
Individual Spike Analysis
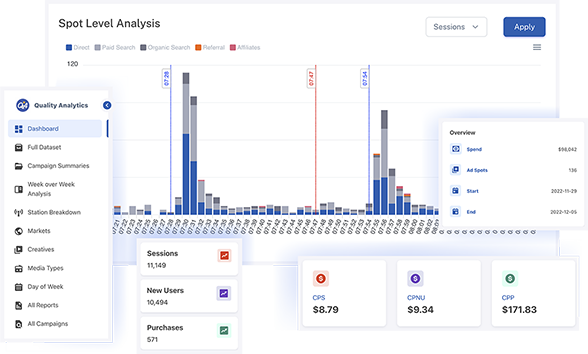
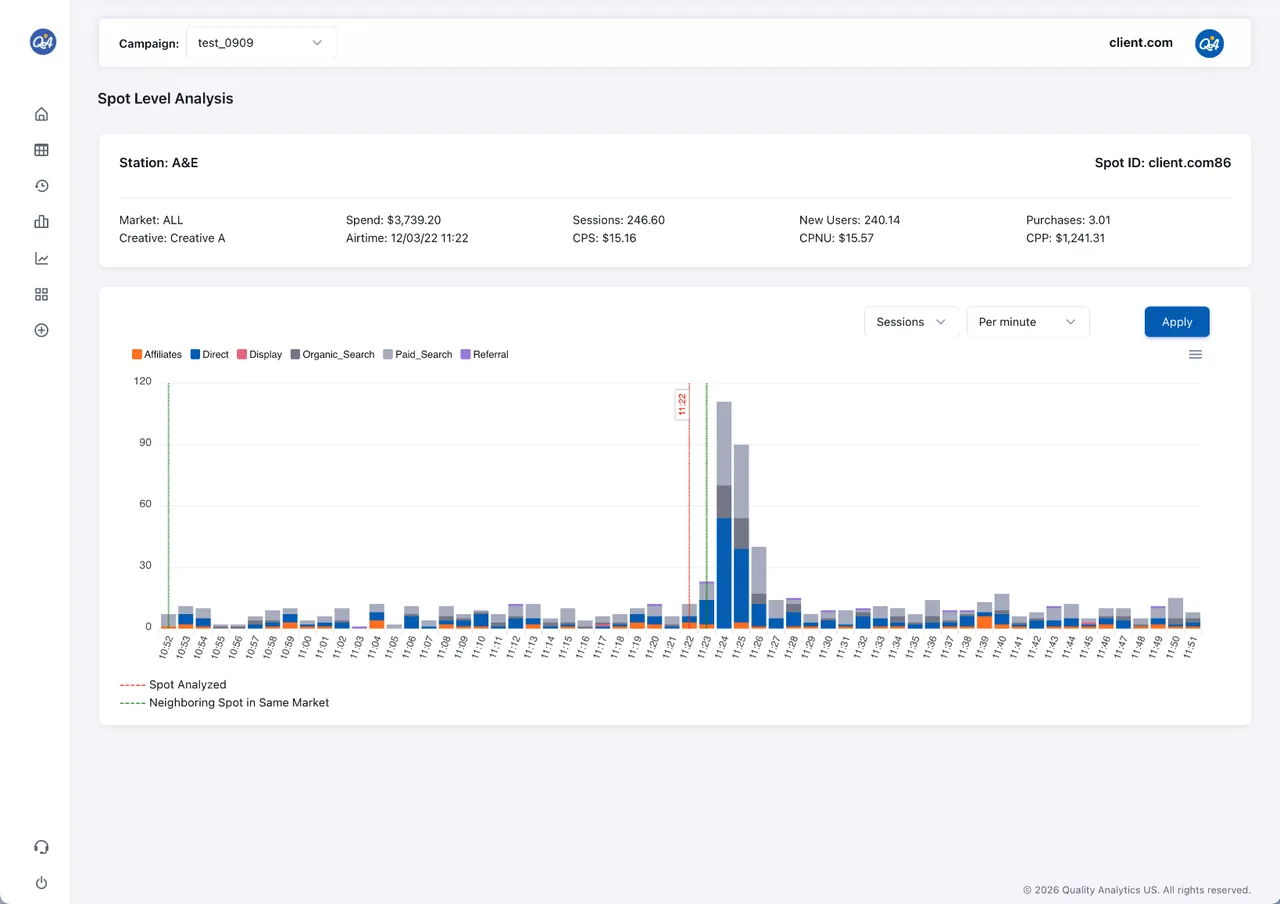
The Individual Spike Chart shows response minute by minute after each airing. You can see exactly when and how the audience responded, which helps with placement, messaging and frequency decisions.
It is also the simplest way to see the method at work: the spike, the baseline, and the difference between them.
Custom Excel Reporting
Request custom Excel reports built around your own questions, whether that is a specific metric, the lift for particular creatives or a comparison across markets.
Tables, charts and filters are fully adjustable, so the output fits the way your team already works.